
00. Meet the Dev Console
You are on Path B: Dev Console. You will use the browser UI for setup, migrations, service startup, and Cloudflare deployment instead of running commands manually. If you prefer the command line, see the CLI path.
Before you start typing a long list of commands manually, take a moment to understand the built-in Dev Console that ships with ZShip.
Its purpose is simple:
- Help you memorize fewer commands
- Help you switch directories less often
- Help you miss fewer steps
If this is your first time using the project, open the Dev Console before going into the deployment steps below.
1. What the Dev Console is
Section titled “1. What the Dev Console is”The Dev Console is ZShip’s built-in local control panel.
After launch, you will see a local page in the browser that helps you manage:
- Getting started
- Local startup
- Cloudflare deployment
- Environment variables
- Database migrations
- Service status
- Brand configuration
- Documentation links
In practice, it is a local operations panel.
You do not need to memorize a large number of commands to understand what is or is not configured correctly.
2. How to start it
Section titled “2. How to start it”Run this from the repository root:
pnpm dev:consoleAfter startup, the browser should open:
http://localhost:3900If it does not open automatically, visit that URL manually.
3. What the Dev Console is good for
Section titled “3. What the Dev Console is good for”If you are new to the project, these are the parts you will use most often.
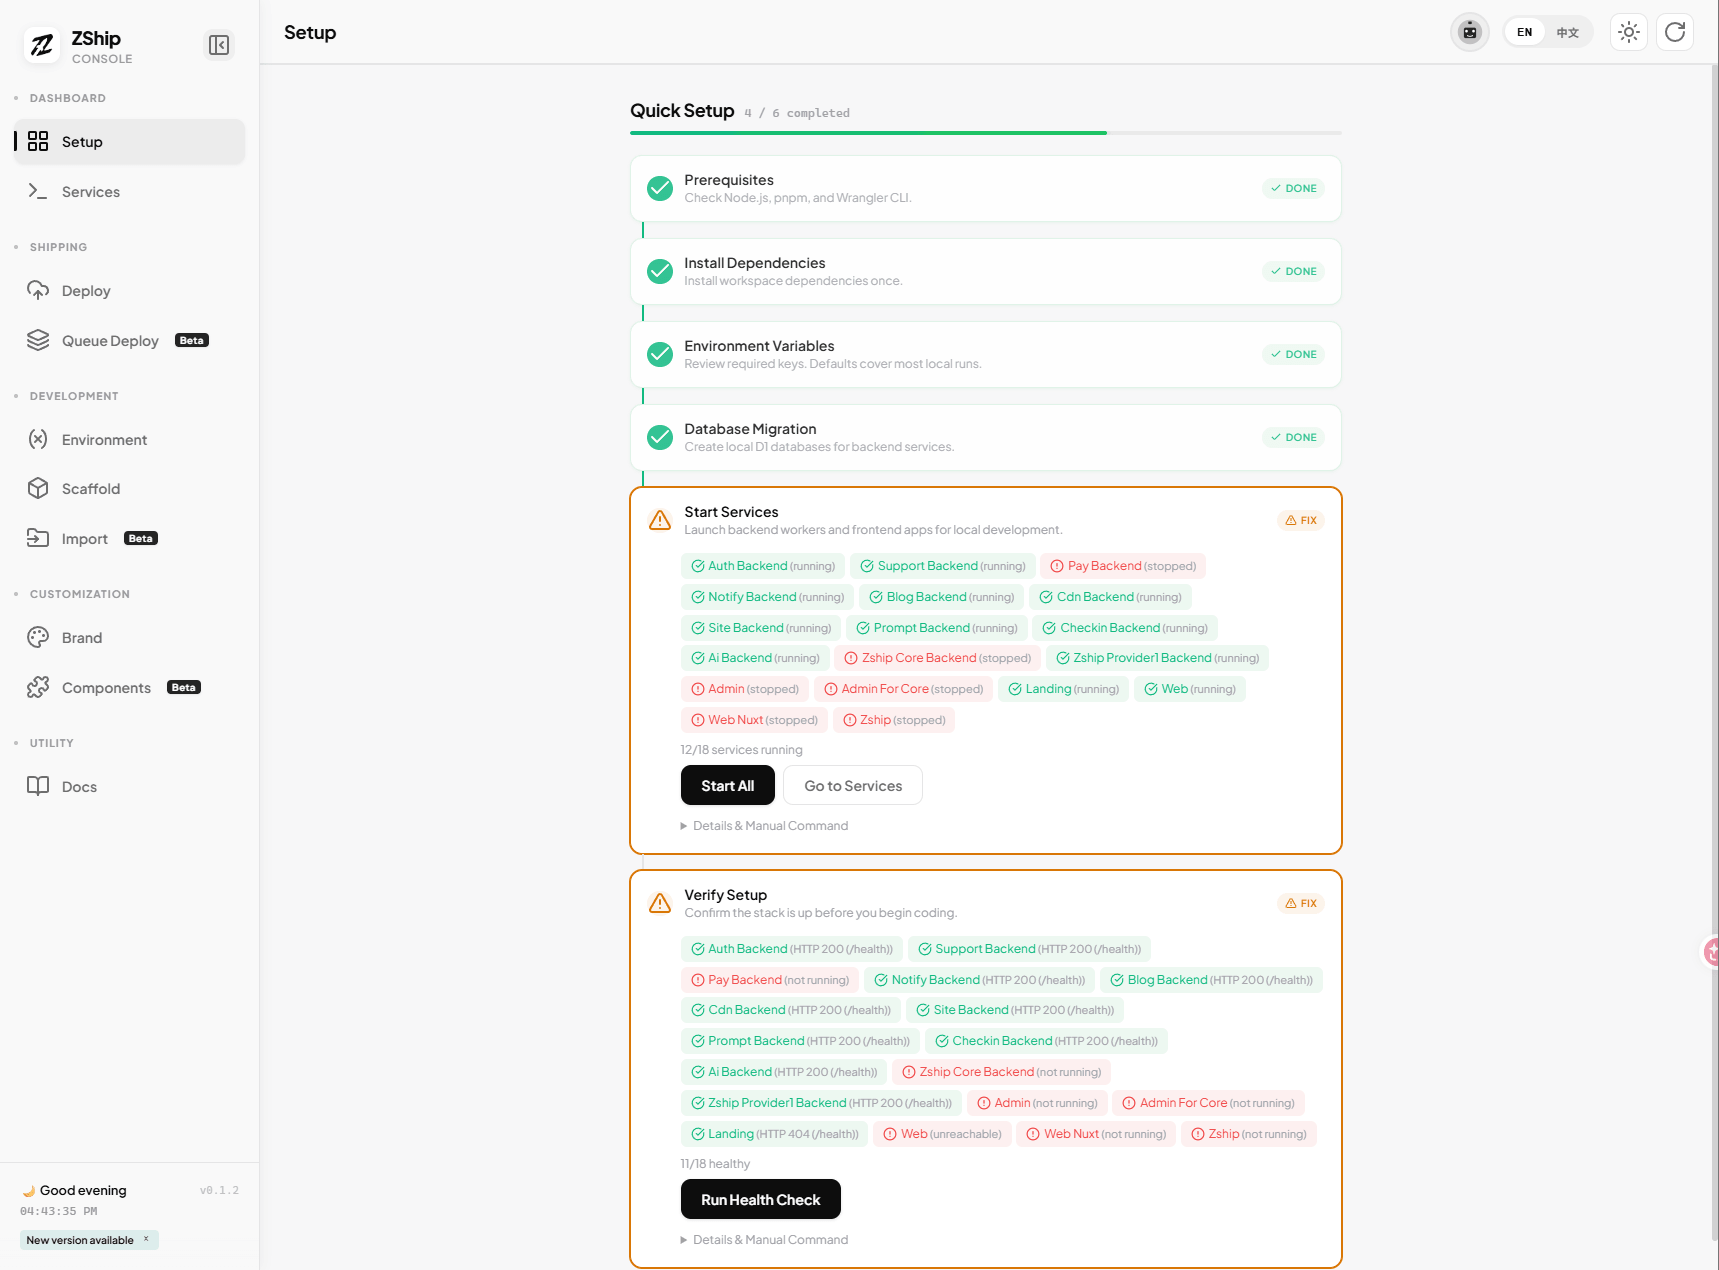
1. Getting Started
Section titled “1. Getting Started”It walks you through:
- Prerequisite checks
- Dependency installation
- Environment variable checks
- Database migrations
- Service startup
- Environment verification
This is especially useful when bringing up local development for the first time.
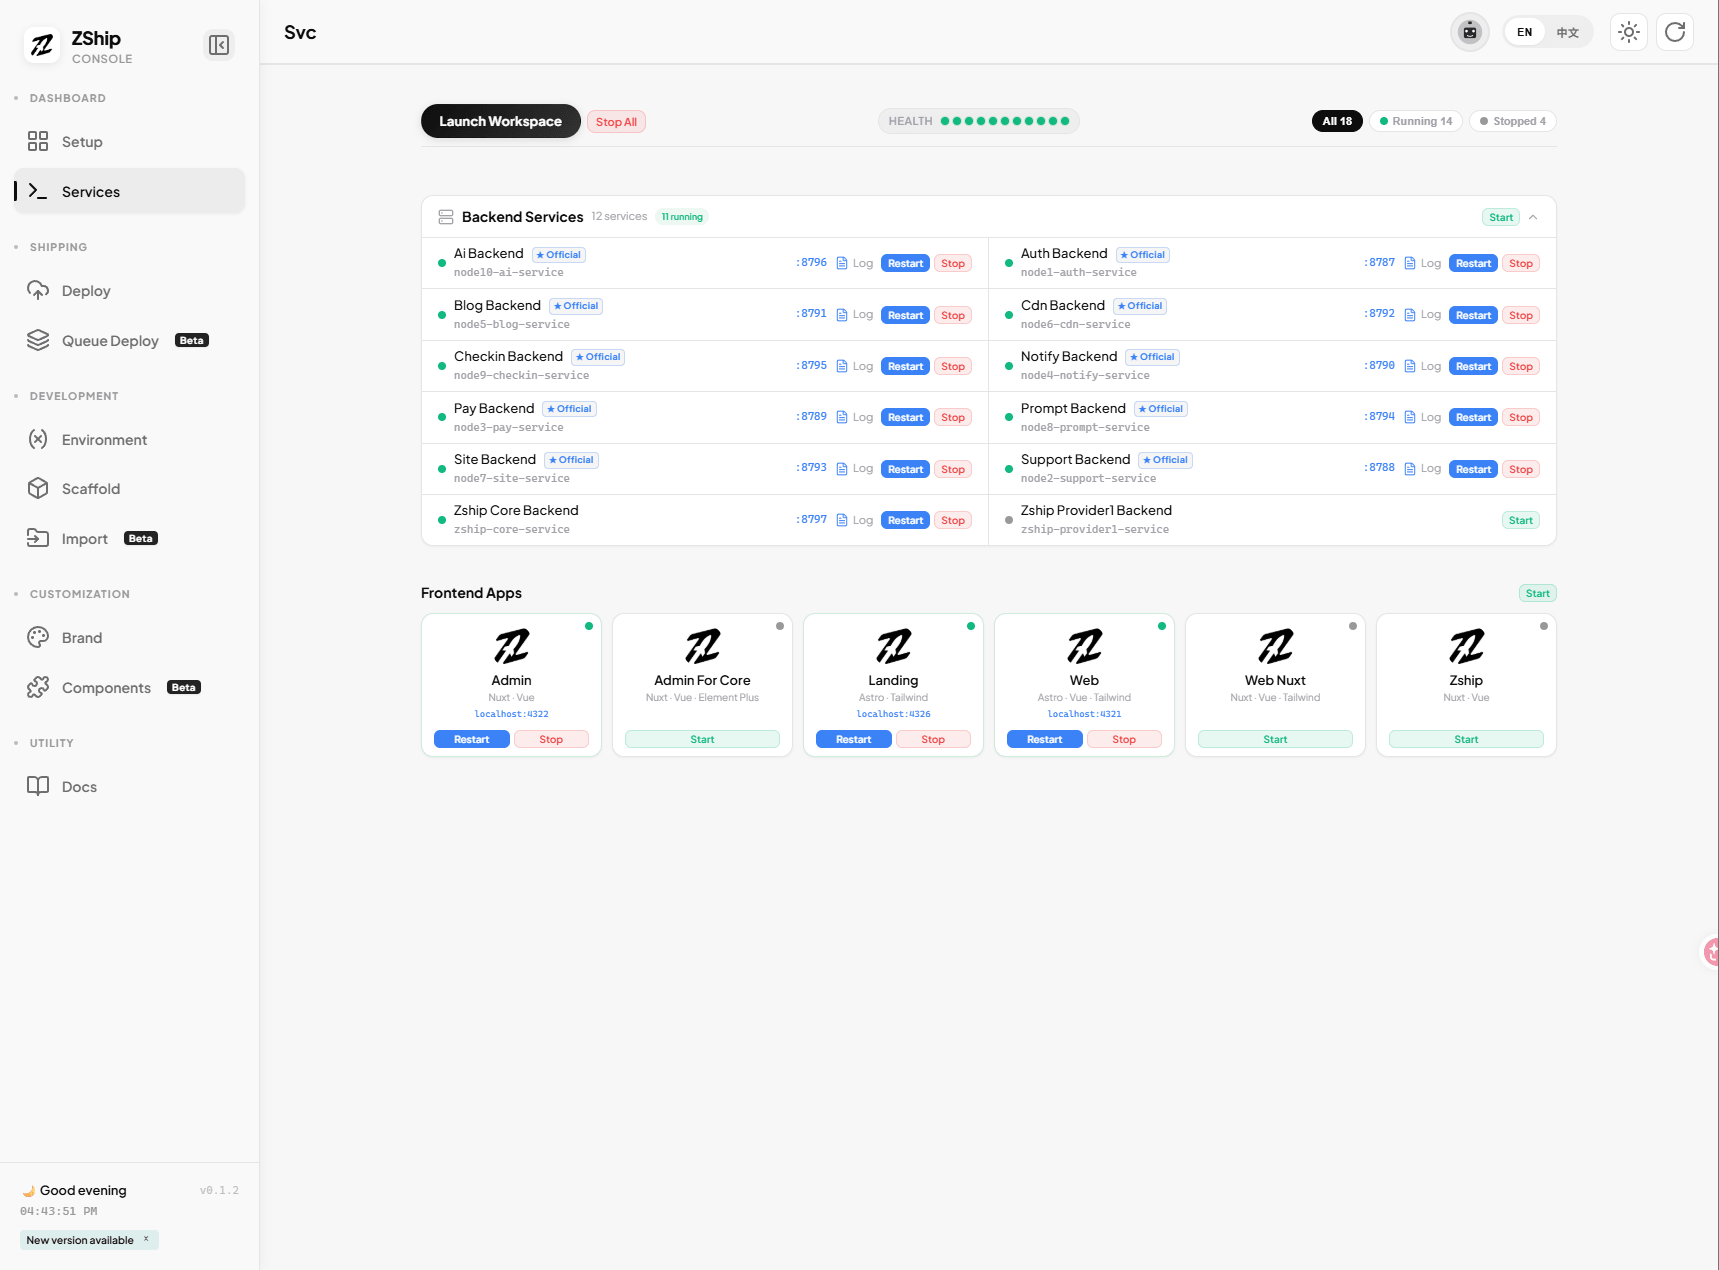
2. Local Startup
Section titled “2. Local Startup”In the UI you can see:
- Backend service list
- Frontend app list
- Whether each service is currently running
- The local port for each service
- The logs for each service
That is much easier than manually watching a dozen terminal windows.
3. Environment Variables
Section titled “3. Environment Variables”You can inspect and edit these directly in the browser:
- Backend
wrangler.jsonc - Frontend
.env
This is extremely helpful for new users, because a common first blocker is simply not knowing which file they are supposed to edit.
4. Database Migrations
Section titled “4. Database Migrations”The console can help you run local database migrations.
That matters a lot during the first local setup.
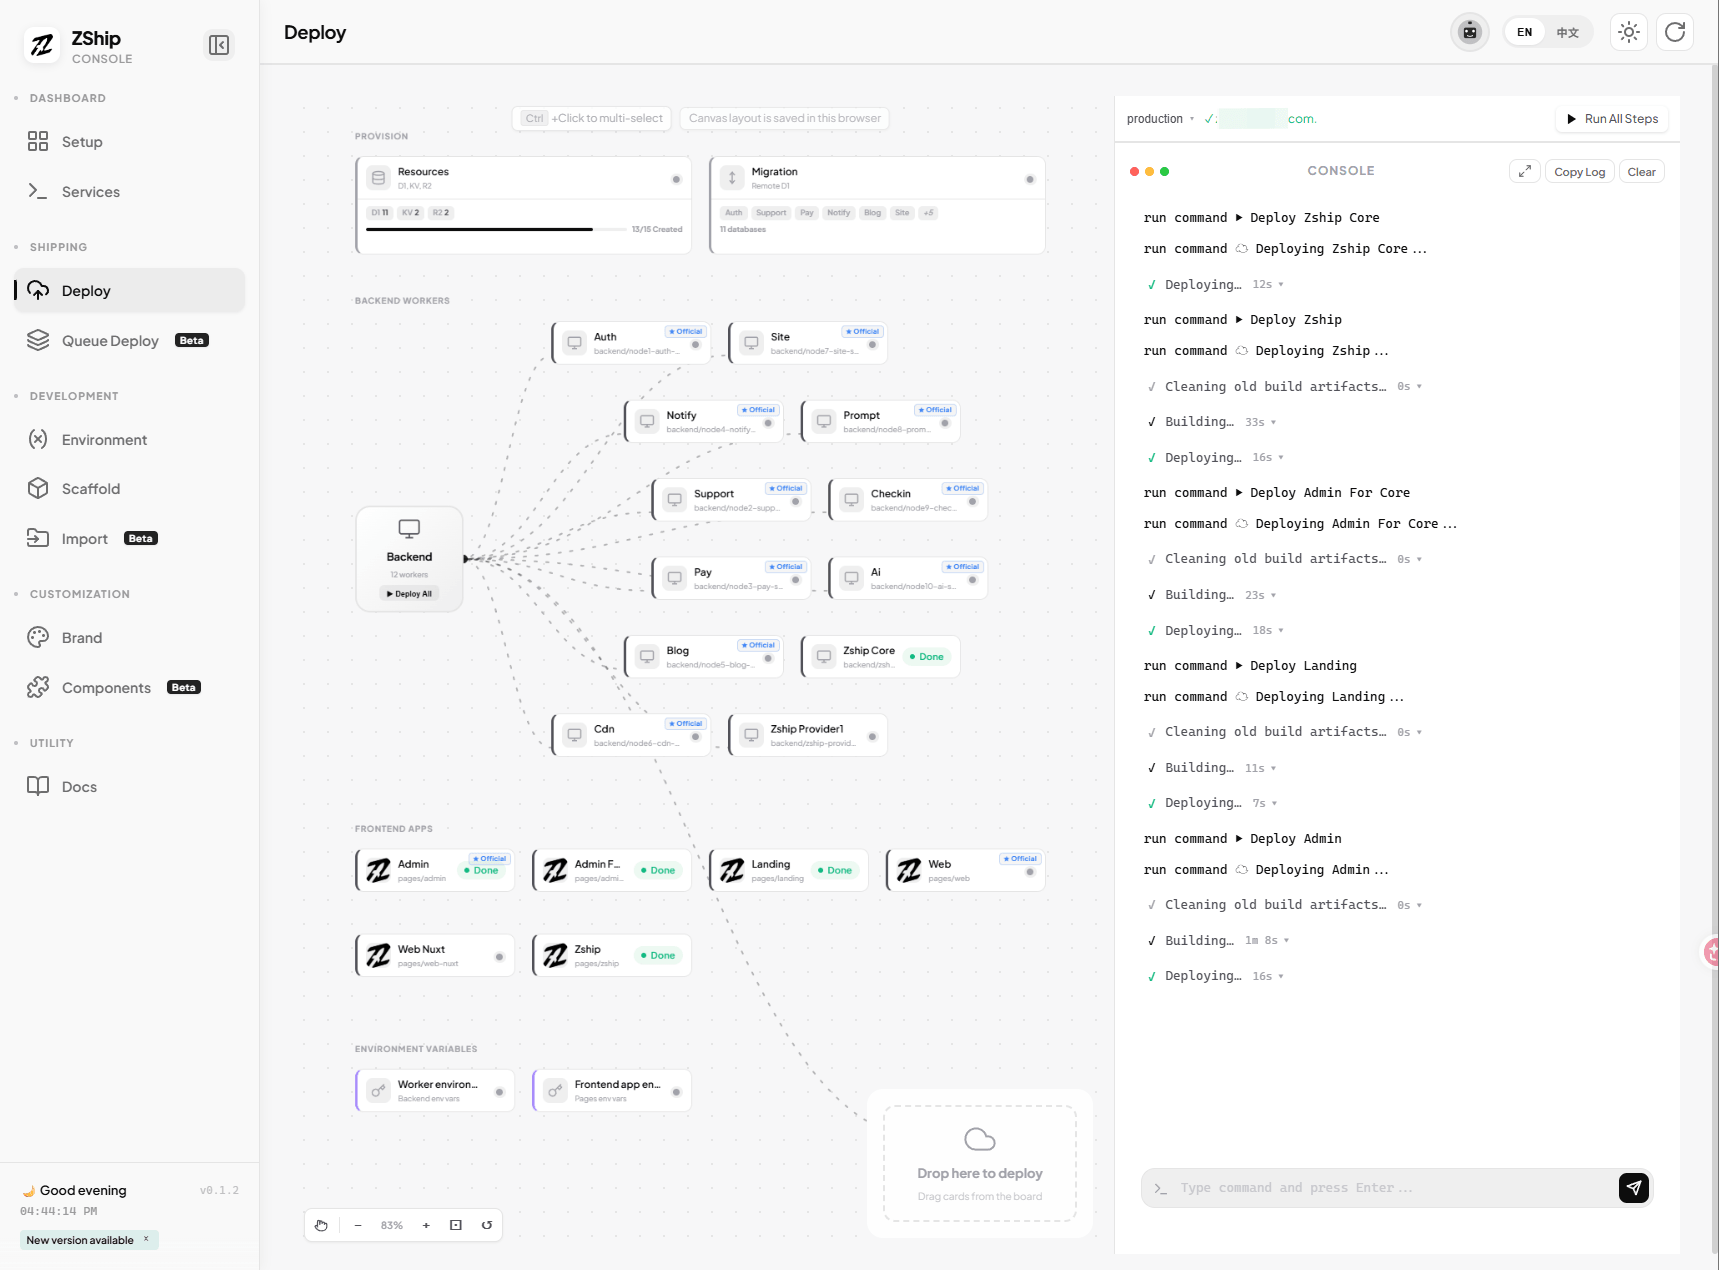
5. Cloudflare Deployment
Section titled “5. Cloudflare Deployment”Switch to the Deploy tab and click Run All. The console will automatically:
- Create D1, KV, R2 resources
- Run database migrations
- Deploy Workers to Cloudflare
- Deploy admin and web to Cloudflare Pages
Fully automated. See 02. Deploy to Cloudflare for details.
4. Dev Console vs Cloudflare Dashboard
Section titled “4. Dev Console vs Cloudflare Dashboard”| Situation | Prefer |
|---|---|
| One place for checks, migrations, deploys, editing Worker env vars, then Push | Dev Console (Deploy to Cloudflare and env tooling) |
Routine updates to CDN_PUBLIC_URL / cdn backend vars plus redeploy | Dev Console → Shipping → Deploy → Environment variables (see Troubleshooting §3) |
| Production error stacks, request traces, console output for Workers / Pages | Cloudflare Dashboard → Observability (Troubleshooting §2) |
| First-time R2 Custom Domains and bucket settings in the web UI | Cloudflare Dashboard → R2 (Troubleshooting §3, Path A) |
Rule of thumb: stay in Dev Console whenever you can; open the Dashboard mainly for Observability, R2 hostname setup, and any workflow you prefer to click through in the CF UI.
5. When to use the Dev Console (day to day)
Section titled “5. When to use the Dev Console (day to day)”Use the Dev Console when:
- You are starting the local environment for the first time
- You want to deploy to Cloudflare (one-click)
- You want to confirm whether services started correctly
- You want quick access to a service’s logs
- You are unsure which environment variables need to be changed
6. What you should do now
Section titled “6. What you should do now”If you have never opened the console before, run this now:
pnpm dev:consoleThen switch to the Deploy tab and click Run All when you are ready to deploy to Cloudflare.